Fractals are mathematical sets showing a repeating pattern at every scale. Fractal patterns are fascinating and are commonly found in nature, for example in cauliflowers, broccoli, lungs, or trees.
LaTeX can generate complex fractals with few lines of code but needs some packages to do that. So let’s prepare the LaTeX environment from scratch by installing all the necessary packages (and prepare a cup of coffee in the meantime):
sudo apt-get install latex209-base latex209-bin latexmk texlive-full texlive-math-extra texlive-extra-utils texlive-generic-extra texlive-latex-extra
The standalone package needs to be installed manually as it is not currently present in the Ubuntu repositories:
# navigate to your local texmf folder (could also be ~/texmf or ~/.texmf)
cd ~/.texmf-var
# download the standalone package
wget  http://mirrors.ctan.org/install/macros/latex/contrib/standalone.tds.zip
# unzip it in the texmf folder
unzip standalone.tds.zip -d .
# update the texmf folder
texhash ~/.texmf-var
# remove the zip file
rm standalone.tds.zip
I noticed that PDF readers like evince and okular do not always show the generated fractals in high definition whereas Adobe Reader always does. If you experience the same issue install Adobe Reader:
# enable Canonical partners repositories
sudo add-apt-repository "deb http://archive.canonical.com/ $(lsb_release -sc) partner"
# update the repositories
sudo apt-get update
# install Acrobate reader
sudo apt-get install acroread
The first fractal I am going to draw is the Mandelbrot set. Here is the LaTeX code using the tikz package:
\documentclass{article}
\usepackage{tikz}
\usetikzlibrary{shadings}
\begin{document}
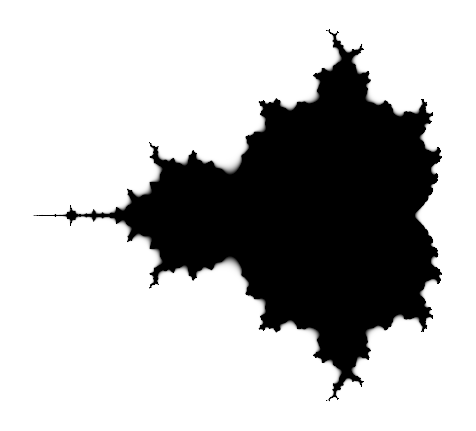
\tikz\shade[shading=Mandelbrot set](0,0) rectangle (15,15);
\end{document}
To compile the tex file from the command line you can use the latexmk utility previously installed. I noticed that evince and okular don’t show this fractal in high definition so it’s better to open it with Adobe Reader.
latexmk -pdf mandelbrot.tex
acroread mandelbrot.pdf &
The fractal looks like this (and like this in PDF):
Another approach is to use the pst-fractal package based on the PSTricks package which is more powerful (but slower to compile) than the tikz package. Here is the code using pst-fractal:
\documentclass[border=12pt]{standalone}
\usepackage{pst-fractal}
\begin{document}
\psset{xWidth=8cm, yWidth=6cm}
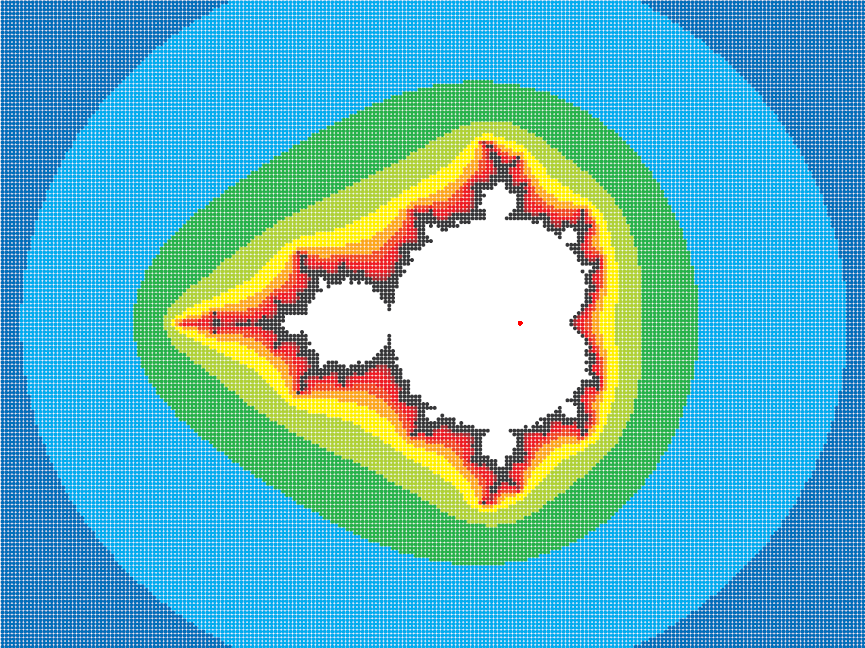
\psfractal[type=Mandel, baseColor=red, maxRadius=30, dIter=30, cx=-1.3](-3,-2) (2,2)
\end{document}
You should compile it with xelatex and wait a bit more until you get the message Output written on filename.pdf (1 page) . This time you can open it in high definition also with evince or okular:
xelatex mandelbrot-colour.tex
evince mandelbrot-colour.pdf &
And this is the result in full colour (here is the PDF):
I am now going to draw the Julia set. Again, I use the pst-fractal package. Here is the LaTeX code:
\documentclass[border=12pt]{standalone}
\usepackage{pst-fractal}
\begin{document}
    \psset{xWidth=8cm, yWidth=8cm}
    \psfractal[dIter=10, cx=-1.3,cy=0](-2,-2) (2,2)
\end{document}
Compile it with xelatex as usual (and go for a cup of tea):
xelatex julia.tex
acroread julia.pdf &
Here is the result (and here is the PDF):

Sources:
Mihalis Tsoukalos, LaTeX: Make text beautiful, Linux Format 201, Summer 2015
http://tex.stackexchange.com/questions/39474/generate-mandelbrot-images-using-tikz
One thought on “How to draw fractals in LaTeX”